This is the most complex project I have created so far. To open it in the Tableau public profile, please click <<here>> or on the image above. The first page gives you more information on the contents. You can also view a static Powerpoint overview of the content <here>, which however obviously lacks the interactivity of the live visualisations.
How I gathered, transformed, cleaned and modeled the data for this visulisation, you can read in this article.
Please note that the country borders don’ t reflect the shape of FIRs and the thus the areas of responsibility of the national ANSPs, additionally MUAC is missing from the map. I could visualise the FIRs boundaries by using a geojson file, nevertheless the source en-route data is provided by country.
Copyright notice and disclaimer:
Eurostat has a policy of encouraging free re-use of its data, both for non-commercial and commercial purposes.
The delay data is published by the EUROCONTROL Performance Review Unit in the interest of the exchange of information. It may be copied in whole or in part providing that this copyright notice and disclaimer are included.
Data relationships and dictionary
The figure below shows how the data in the visualisation are modeled (relationships between them).

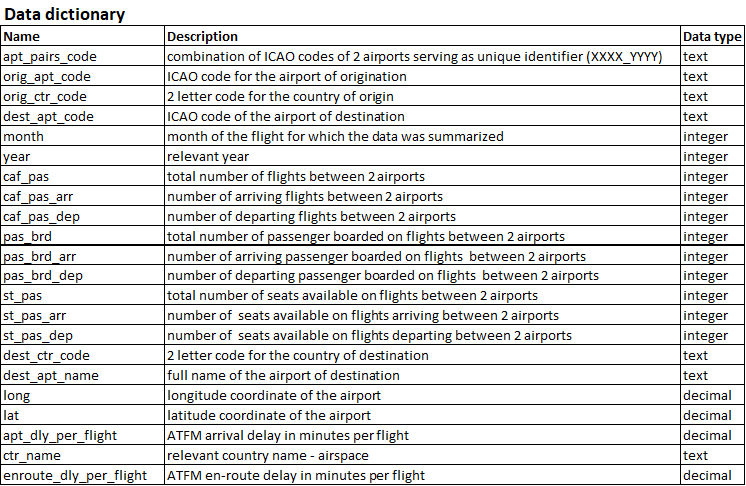
And the data dictionary (metadata):