This is quite a simple visualisation which is mostly supposed to demonstrate 2 purposes. First, an animation of data – how the rank of the busiest airports changed over the years.
Another (the main) purpose of this small project was to showcase how the data for this visualisation can be aggregated from a source dataset, using 3 different means – Excel, SQL and R. The article also contains the legal information on the dataset source (EUROCONTROL).
The visualisation shows top 30 airports in the EUROCONTROL area over the period of 2016-2022 (obviously including the figures fall over the COVID period). The sorting is based on the Number of total IFR movements.
If the animation doesn´t start automatically, please press the “play” button on the bottom right.
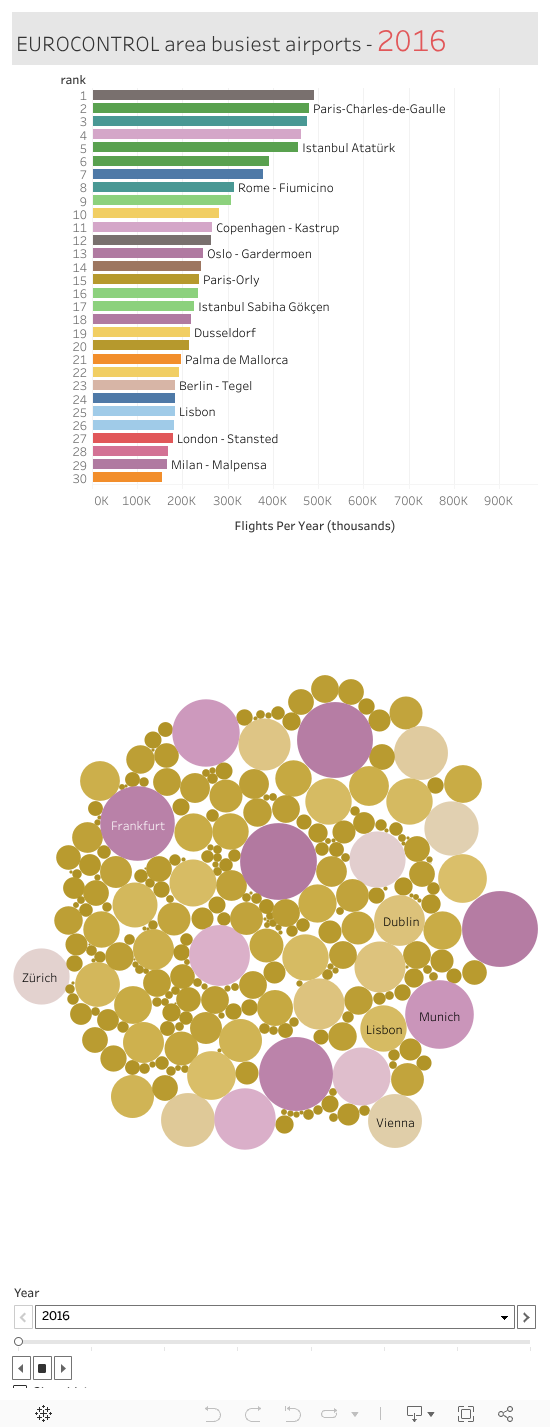
You can note the prominence of the “new” Istanbul Airport.
