In this post I want to show 3 different ways to aggregate the data for the busiest airports in EUROCONTROL area over the period of 2016-2022 vizualization.
In one of them I will be using MS Excel with Pivot Table, second one in the second one a SQL statement (running on a mock database table created in MS Access). The third way will be using R language, running RStudio.
The source of the data is the Airport Traffic dataset from EUROCONTROL, available here.
Disclaimer:
This data is published by the EUROCONTROL Performance Review Unit in the interest of the exchange of information. It may be copied in whole or in part providing that this copyright notice and disclaimer are included. The information may not be modified without prior written permission from the EUROCONTROL Performance Review Unit.
These are the metadata from the dataset:
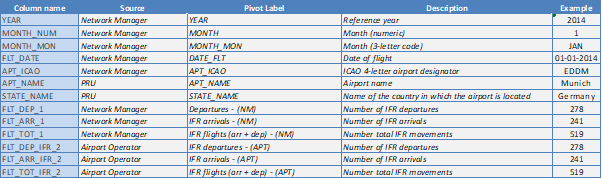
Excel
Getting (aggregating) this data in a Pivot table is quite simple, which is one of the reasons why it is so popular.
All we have to do is to choose the column FLT_TOT_1 (Number total IFR movements), SUM of it, for the Values, and YEAR and APT_NAME for the Rows (in most cases using the ICAO code would be more exact as it would eliminate the possibility of having incostistencies in the Name field of the airport, which would lead to aggregation mistakes. However the EUROCONTROL data are very constistent in this manner)
Next we want to sort the data.
The resulting data set is what we wanted, however the format is not usable yet for a BI application yet.
To change the format, we must first change, in the tab Design – Subtotals – Do not show subtotals, next Report Layout – Show in tabular form and finally Report Layout – Repeat all items labels. The resulting table is in a format usable in a BI application.
Next we copy the data into a new workbook and paste values only.
We may want to sort the pasta data by Sum of FLT_TOT_1. This was not possible in the Pivot table as it was limited to sorting by Year and SUM (see screenshot of sorting, a bit above).
SQL
The beauty of SQL is that we can get the results usable in BI application in a single SQL statement.
Considering the name of the mock table is „airport_traffic“ and containing the data same column names as the excel file (see metadata) :
SELECT airport_traffic.apt_name, airport_traffic.Year, Sum(airport_traffic.flt_tot_1) AS sum_flt
FROM airport_traffic
GROUP BY airport_traffic.Year, airport_traffic.apt_name
ORDER BY Sum(airport_traffic.flt_tot_1) DESC, Table1.Year DESC;
Compare the result with the final sorted data extracted in Excel.
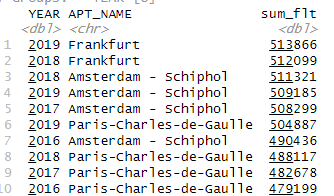
R
Running a command in R (using RStudio) is another great way to aggregate the data, using also just one command.
airport_traffic <- read_csv(“Airport_Traffic.csv”)
Actually thanks to being able to import the CSV data into a data frame and work with it directly is even more straightforward than the previous steps.
airport_traffic %>% group_by(YEAR, APT_NAME) %>% summarise(sum_flt = sum(FLT_TOT_1)) %>% arrange(-sum_flt)