This dataset was created by combining the information from 34 (EU + UK, MK, ME, TR, IS, NO, CH) detailed datasets called Air passenger transport between the main airports of (COUNTRY) and their main partner airports (routes data), available at the EUROSTAT database page.
Honestly, this was so far my biggest data preparation project, I don’t even want to know how much time I spent on it 🙃
Anyhow the struggle was worth, because in the end I have a dataset with around 740 airport pairs (not unique, some of them are the same pairs reversed, to be further analyzed ..) with 9 different data values (seats available, number of flights and number of pax, each in arrivals, departures and totals), divided by month. I filtered the dataset to contain only information from 2018 to 2022, to restrict the file size and query reactivity.
My metholody was to choose top 20 routes/pairs per each state, sorted by the number of passengers in 2019. In some of the bigger (DE, IT, ES, TR, UK, FR) countries I chose 30 routes/pairs as these have much higher figures of numbers transported. The aggregated data has around 41K rows, which would correspond to 34 countries * 21 pairs * 60 months.
One day I may compare if these 740 pairs contain even the top 100 pairs in the area.
Sourcing, transformation and cleaning of the individual country dadasets
The country datasets downloaded from EUROSTAT were in the form of .tsv, tab-separated values, looking like this in a text editor:

To transform and clean them I was using my favorite Power Query (in Excel). Data – Get data – From text file/csv – Choosing the Tab delimiter – Transform data

Even though the values themselves were separated into columns, the first column containg metadata was still collapsed. To fix these I splitted it in PQ – Split Column – By delimiter – Comma

Now the data was finally in a comprehensible form. Next I deleted the first column containing the units (these can be later added in the column names, anyway there were 2 types in this dataset – number of flights and number of pax.)
Next, promoting the first row into headers.
Next I deleted all the columns past 2018, as I decided to work with last 4 years only.
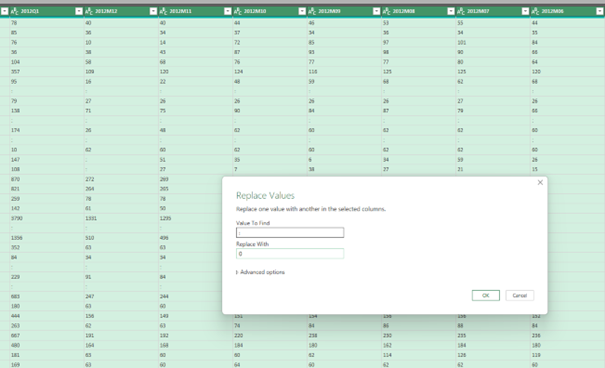
Next I selected all the value columns (all but the first 2) and performed the following steps:
- replacing the values „:“ which meant missing (zero) values with 0 [I realize I maybe should have used (NULL) instead, but I don’t think it broke any calculations]
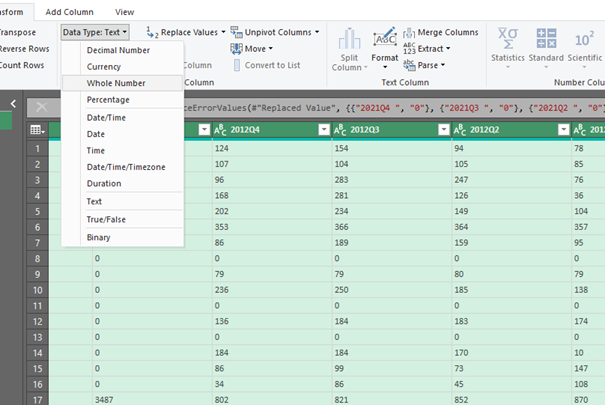
- replacing any errors with zero
- converting the column data type from text to integer (whole number)

My criteria for choosing the top flight routes was the number of passangers on board (PAS_BRD) in year 2019.
This left me with the list of routes sorted in the 2nd column. Now I extracted this list as a new query.


In this new query, I first converted the list into a table to be able to used JOIN with it and left Top 20 rows (30 in case of biggest countries, DE, UK, TR, IT, FR, ES).
Back in the main query, I removed the filter to see and leave values for 9 types of information. ST_PAS for total seats, ST_PAS_ARR and ST_PAS_DEP for number of seats for arrivals and departures, CAF_PAS together with _ARR and _DEP for the number of flights (again also divided) and PAS_BRD, again also with _ARR and _DEP for the number of the passangers on board.
Next to filter out the information for the selected 20 (or 30) airports I use the Merge queries function (akin to JOIN in SQL), with RIGHT OUTER JOIN, using the airport ICAO codes pairs.
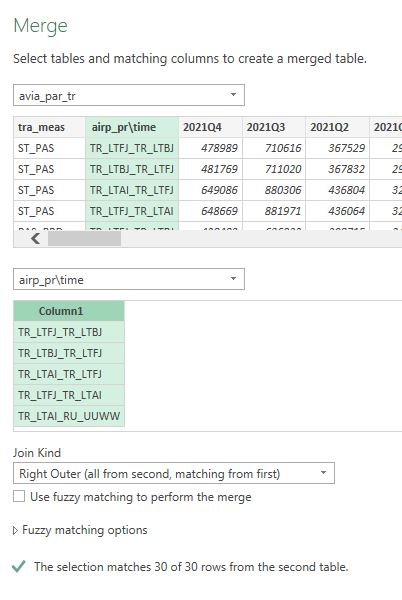
The resulting query would have 180 or 270 rows of data – 9 types of information per 20 or 30 airports. The final step for each country dataset was to convert the data from columnar form into more row-based form, which works better in BI applications. To do this, I unpivoted the value columns.

Combining the individual country subsets into one dataset

Still/again in PQ, I appended the individual 30+ queries into one table. After appending the resulting individual countries I ended up with cca 550 000 rows.
For the monthly data, I needed to extract only the relevant values, leaving out the quarterly and yearly data (which I later extracted into a separate dataset).
In here, I had to extract to convert the text value like YYYY“M“MM into YYYY and MM columns, using Split by delimiter


For the resulting data, I aggregated these using Pivot table.

Adding airport names and locations
I copied the pivot table data into a new worksheet and decided to do some final edits for better analysis and comprehension.
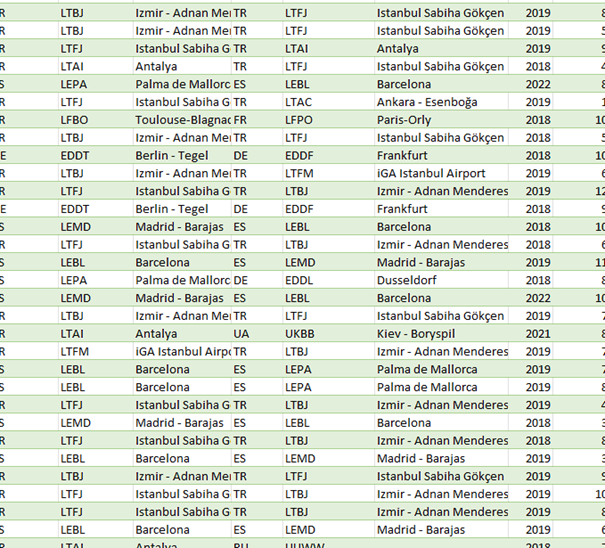
The most useful step was to divide the aiport pairs column into the origin and destination country and airport, these will be great for further analysis purposes.

To add airport names, I used the list I extracted from one of the EUROCONTROL airport traffic datasets (Copy – Data – Remove duplicates) – 333 values. I added this as a query a combined them as a LEFT INNER JOIN, getting the names for the ICAO Codes.
Unfortunately, some of airports (those outside EUROCONTROL area) were not in this table.
To be able to use the map visualisation, I needed the airports location.
To gain the location data I used the dataset from ourairports.com website. The dataset is a public domain.
In Power Query I loaded the .csv file and cleaned the columns that I wouldnt need.
I my airport pairs dataset I extracted the number of unique airports and merged the two list to gain the information for the airports I needed.

To add the location data into the airport pairs dataset, I used the =VLOOKUP function in Excel.
